Lesson: Technical Analysis – Part 1
Focus: Relative Strength Index (RSI) and Market Illusions
In most technical analysis books, the very first rule you are taught to memorize about the RSI (Relative Strength Index) is this: If the RSI crosses above 70, it’s overbought—sell. If it drops below 30, it’s oversold—buy.
However, any veteran trader who has spent years in the spot, forex, or crypto markets knows the truth: relying on this rule in isolation is a complete liquidity trap. During a strong bull trend, the RSI can easily hover in the 80-90 range for days. If you open short positions purely because the asset is “overbought,” you simply become the small fish eaten by the market makers.
So, how should we actually use the RSI in the real market as a genuine signal generator? Let’s dive into it.
1- RSI Divergences
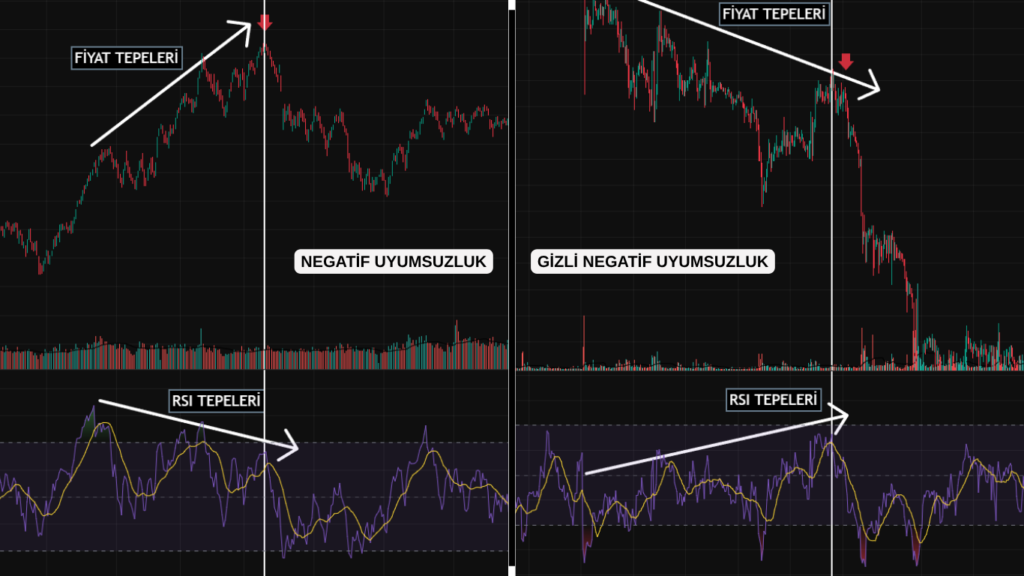
These typically occur at the exhaustion points of upward and downward price waves. A divergence emerges when the price peaks or troughs begin to move in the opposite direction of the RSI, signaling that a trend reversal may be imminent in the market.
- Negative (Bearish) Divergence: This occurs when the price chart forms “Higher Highs” (HH), while the RSI forms “Lower Highs” (LH). It indicates that the bullish momentum is weakening and a potential downturn is just around the corner.
- Hidden Negative (Bearish) Divergence: This occurs when the RSI forms “Higher Highs” (HH), while the price chart forms “Lower Highs” (LH). It indicates that despite the upward push in momentum, the price lacks the strength to break its previous peak, signaling that the bullish power is fading and a potential drop could be imminent.
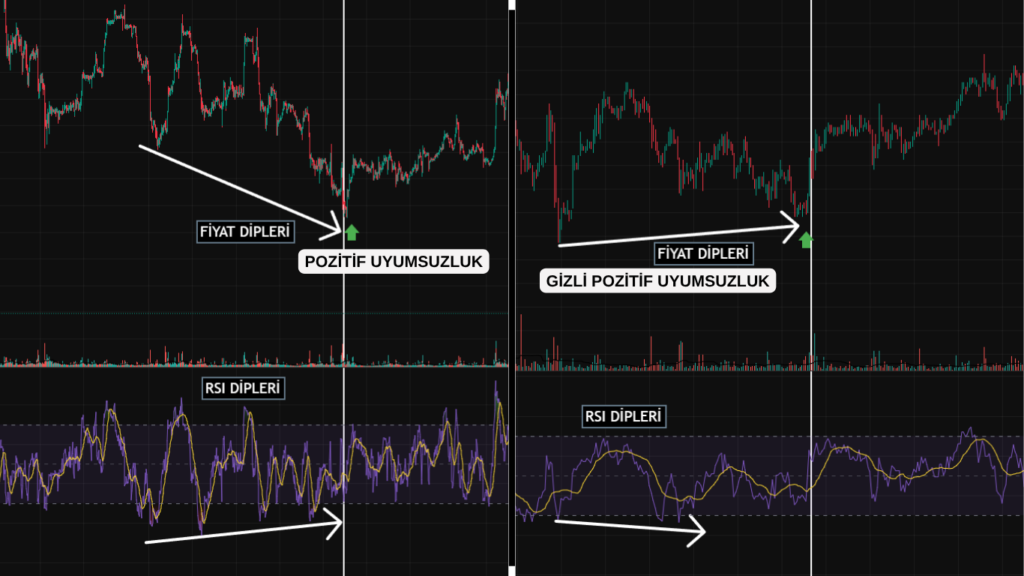
Positive (Bullish) Divergence: This occurs when the price chart forms “Lower Lows” (LL) while the RSI forms “Higher Lows” (HL). This indicates that the current downtrend is losing its momentum, signaling a potential upward reversal in the market.
Hidden Positive (Bullish) Divergence: This occurs when the price chart forms “Higher Lows” (HL) while the RSI forms “Lower Lows” (LL). It indicates that despite the downward push in indicator momentum, the price remains strong enough not to break its previous trough, signaling that the underlying upward movement is likely to continue.
2- The 60 Reference Level and Trend Confirmation
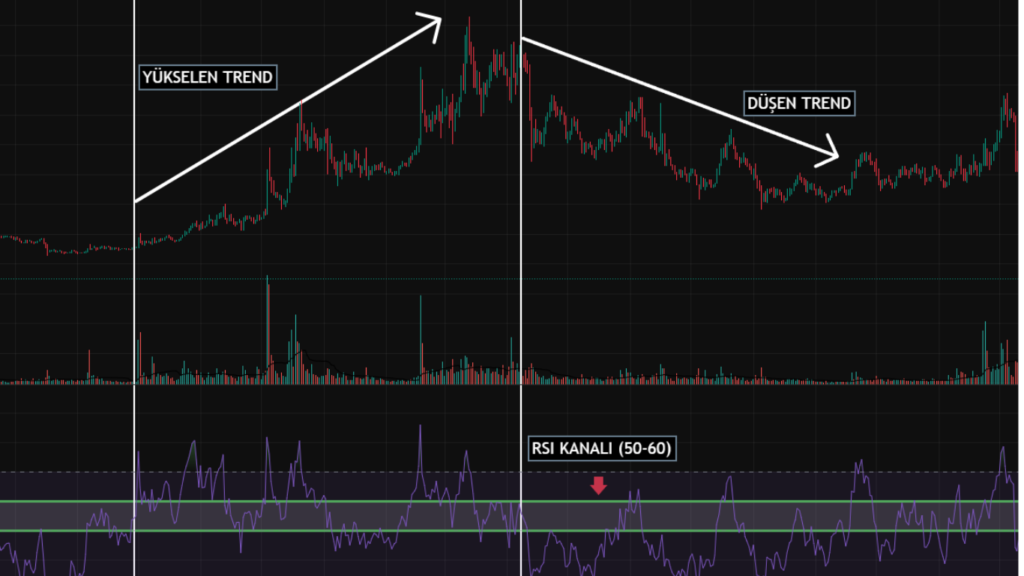
YÜKSELEN TREND: UPTREND, DÜŞEN TREND: DOWNTREND, RSI KANALI (50-60): RSI ZONE (50-60)
Contrary to popular belief, the RSI 50 level (the midline) does not play a critical role in determining trend direction. The truly crucial point, especially in newly maturing trends, is the 60 level. This specific level acts as a strong catalyst, amplifying the power of an uptrend.
- If the RSI consistently stays above the 60 level (and finds support in the 50-60 zone during market corrections), the market is in a clear uptrend.
- If the RSI consistently stays below the 60 level (and faces resistance in the 50-60 zone during price bounces), the market is in a clear downtrend.
3- Tracking RSI Trends Alongside Price Action
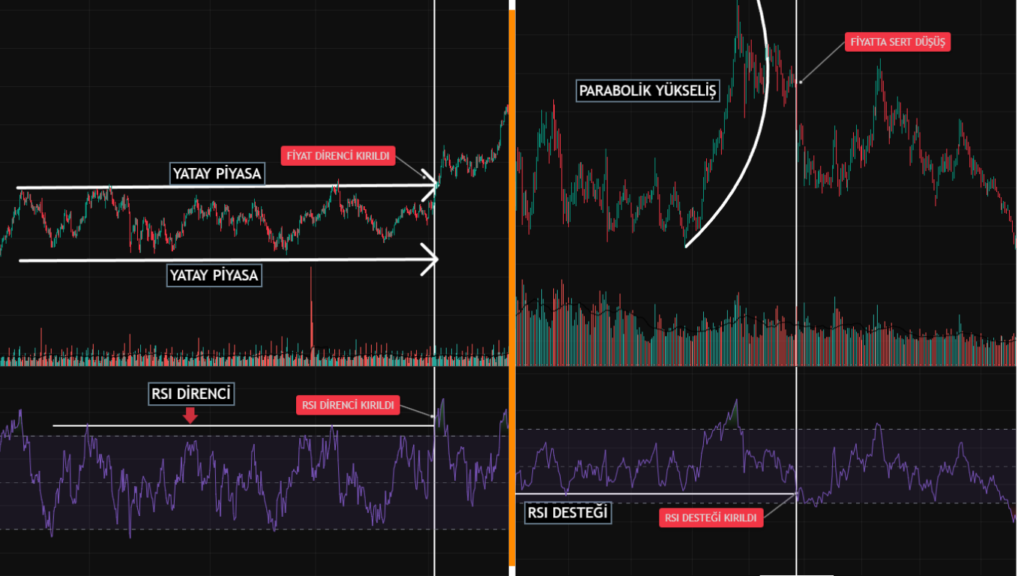
YATAY PİYASA: RANGING MARKET , FİYAT DİRENCİ KIRILDI: PRICE BREAKOUT, RSI DİRENCİ: RSI RESISTANCE, RSI DİRENCİ KIRILDI: RSI BREAKOUT, PARABOLİK YÜKSELİŞ: PARABOLIC ADVANCE, FİYATTA SERT DÜŞÜŞ: SHARP PRICE DECLINE, RSI DESTEĞİ: RSI SUPPORT, RSI DESTEĞİ KIRILDI: RSI SUPPORT BROKEN
- Just like price charts, the RSI can form its own trends and patterns independent of direct price movements. This feature becomes exceptionally crucial during periods of market consolidation (ranging markets) or when identifying parabolic price actions.
- In our first chart, the breakout of the RSI resistance serves as an early signal, triggering the exit from the ranging market. In our second chart, we observe a parabolic uptrend in price. Throughout this parabolic rise, the RSI establishes and maintains a distinct support level. Once this underlying RSI support is broken, it acts as a leading indicator, and the sharp pullback in price immediately follows.
4- Failure Swings
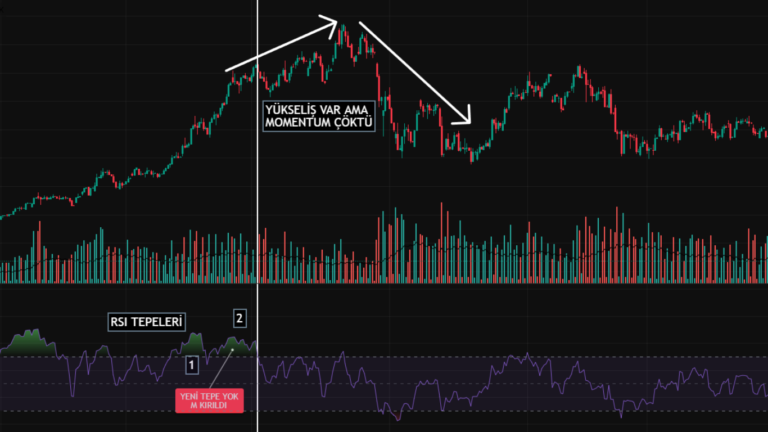
YÜKSELİŞ VAR AMA MOMENTUM ÇÖKTÜ: PRICE IS RISING BUT MOMENTUM COLLAPSED, RSI TEPELERİ: RSI PEAKS, YENİ TEPE YOK M KIRILDI: NO NEW HIGH, ‘M’ BROKEN
- Top Failure Swing (Bearish Reversal / Sell Signal)
You can think of this as an “M” shape forming on the RSI line where the right leg is shorter, or as a failed “Double Top” formation. It clearly indicates that the bullish momentum is exhausted.
The event unfolds in the following sequence:
- First Peak: The RSI is very strong and crosses above the 70 level (e.g., reaching 75). This forms the left leg of the “M” shape.
- Trough (Support): The RSI pulls back slightly, dropping to the 60 level, for instance. This becomes our support point on the RSI—essentially the dip in the middle of the “M”.
- Second Peak (Failure): Buyers attempt to regain strength, and the RSI rises, but it lacks the power to surpass the first peak. It might reverse from 68, for example. (It can remain below 70, or go slightly above 70, but it strictly stays below the first peak). This forms the shorter right leg of the “M”. This is exactly where the “Failure” occurs; the momentum has failed to make a new higher high.
- Breakdown (Signal): The RSI turns downwards and breaks below the trough (support) it established at the 60 level in step 2.
- Conclusion: The exact moment of this breakdown is a highly powerful sell (or take-profit) signal, proving that momentum has decisively collapsed, even if the price chart still appears to be climbing.
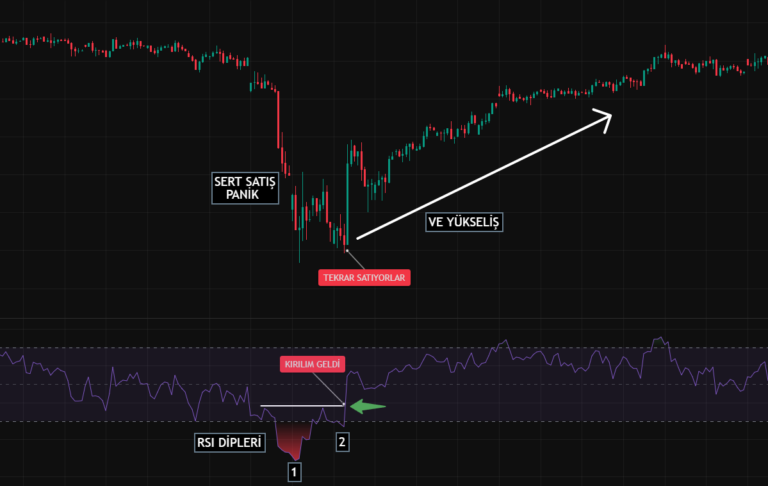
SERT SATIŞ PANİK: PANIC SELLING, TEKRAR SATIYORLAR: SECONDARY SELL-OFF , VE YÜKSELiŞ: THE RALLY BEGINS, KIRILIM GELDİ: BREAKOUT CONFIRMED, RSI DİPLERİ: RSI TROUGHS
- Bottom Failure Swing (Bullish Reversal / Buy Signal)
You can think of this as a “W” shape forming on the RSI line where the right leg is shorter (higher), or as a “Double Bottom” formation. It clearly indicates that the downward momentum is completely exhausted.
The event unfolds in the following sequence:
- First Trough (First Dip): There is panic selling in the market, pushing the RSI below the 30 level (e.g., dropping to 25). This forms the left leg of the “W” shape.
- Peak (Resistance): Driven by reaction buying (a relief rally), the RSI bounces upward and reaches the 40 level, for instance. This becomes our resistance point on the RSI—essentially the peak in the middle of the “W”.
- Second Trough (Failure): Sellers push the market down once more, and the RSI drops. However, the sellers lack the strength to break below the first trough. It reverses from 32, for example. (The second trough must inevitably form above the first trough). This is exactly where the “Failure” occurs; sellers have failed to force a new lower low.
- Breakout (Signal): The RSI turns its direction upwards again and breaks above the peak (resistance) it established at the 40 level in step 2.
- Conclusion: The exact moment of this breakout is a highly powerful buy signal, demonstrating that the downtrend has lost its momentum and buyers are beginning to take control of the market.
Summary: Wilder’s Failure Swings rule tells us this: stop looking at the price chart and focus solely on the RSI line. If the RSI creates its own support and breaks below it, get out; if it creates its own resistance and breaks above it, enter the trade. Momentum precedes price.