Lesson: Fundamental Analysis – Part 1
Odak: In-Depth Analysis of ROA (Return on Assets) and ROE (Return on Equity) Ratios
1- Fundamentals, Not Window Dressing
Teknik analiz bize tahtadaki momentumu ve piyasa psikolojisini (ne zaman işlem yapılacağını) söylerken; temel analiz, “O hisseyi neden almalıyız?” sorusuna cevap verir. Bir şirketin vitrini (satışları, reklamları) harika görünebilir, ancak asıl hikaye bilançoların arka odasında yazılır. Şirket yönetimi, elindeki parayı ne kadar verimli kullanıyor? Bu sorunun cevabını bulmak için finansal tabloların en güçlü iki röntgen cihazını kullanacağız: ROA ve ROE.
2- ROA (Return on Assets): The Efficiency of the Machine
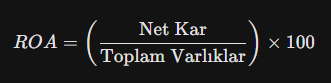
ROA = (Net Income / Total Assets) x 100
What Does It Tell Us? It demonstrates the operational mastery of the company’s management. It is the ultimate metric of how effectively the management puts its available resources (assets) to work. For example, an ROA of 5% means that for every 100 TL of assets the company owns, it successfully generates 5 TL in net profit.
3- ROE (Return on Equity): The Real Value Entering the Shareholder’s Pocket
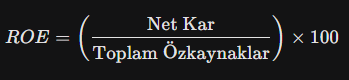
ROE = (Net Income / Total Equity) x 100
If ROA measures the efficiency of a company’s total assets, Return on Equity (ROE) directly measures how efficiently the capital injected into the company by the shareholders is being utilized.
- What Does It Tell Us? It shows the return on the money invested by business owners and investors. A high, stable ROE that consistently beats inflation is the ultimate hallmark of a high-quality company.
4- Breaking the Illusion: The Leverage Effect and Sectoral Reading
The biggest amateur mistake made in ROA and ROE analysis is comparing different sectors with each other or simply being deceived by a high ROE.
This is because the golden rule of accounting is as follows: Total Assets = Equity + Liabilities (Debt)
If a company operates by borrowing excessively, its equity remains very small compared to its assets. Mathematically, this situation artificially inflates the ROE. There is a profitability illusion at play; the company appears to be generating fantastic profits, but in reality, it is playing a highly risky game under a massive debt burden.
Case Study: The Turkish Banking Sector These two ratios play a vital role in analyzing the financial health of institutions. Especially when examining the Turkish banking sector (major players like Akbank, Garanti BBVA, İş Bankası, and VakıfBank), one must correctly understand the intrinsic nature of their balance sheets:
- By their very structure, banks hold extremely high assets (the deposits they collect and the loans they grant). For this reason, ROA ratios in banking appear much lower compared to industrial companies (typically, a 2%-4% range is considered quite strong in this sector).
- However, when it comes to ROE, we see how effectively banks utilize their capital adequacy and their intellectual capital (VAIC) to protect and continuously grow their equity against inflation.
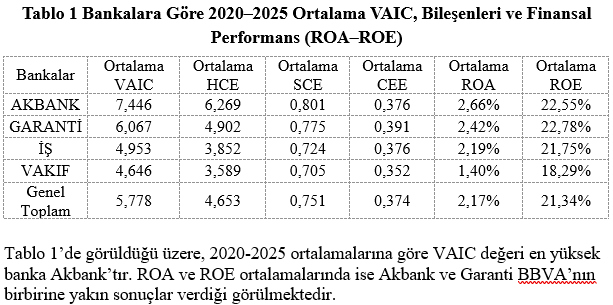
As seen in Table 1, based on the 2020–2025 averages, Akbank holds the highest VAIC value. Regarding the ROA and ROE averages, it is observed that Akbank and Garanti BBVA produced closely aligned results.
Calculations are based on consolidated bank balance sheets.
5- The Mathematics of the Spread: The Equity Multiplier (Leverage)
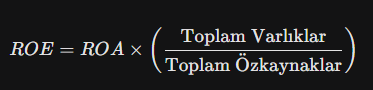
Toplam Varlıklar: Total Assets, Toplam Özkaynaklar: Total Equity
Imagine a bank has an ROA of 2%. At first glance, this might seem very low. However, banks manage a massive pool of assets by collecting customer deposits (i.e., creating liabilities). If the bank’s assets are 15 times its equity (Equity Multiplier = 15), the math works like this:
In other words, a seemingly low ROA of 2% transforms into a robust ROE of 30% thanks to the leverage spread. In the financial sector, this spread is completely natural because the core business model of banking is creating loans (assets) from deposits (debt). However, if a retail or industrial company has an ROA of 2% while its ROE spikes to 30%, this wide gap stems not from the company’s operational success, but from dangerously high levels of debt, creating massive risk during a potential crisis.
6- Conclusion: Reading the Compass Correctly
A professional value investor never makes a decision based on a single ratio. A truly strong balance sheet is one where both the ROA and ROE are above their respective industry averages, and the spread between these two ratios is not driven by “excessive and dangerous borrowing.”